The history of a project's previous analyses will become available after the first analysis has been completed. You can reach the Analysis History page from:
- The Project Analysis Dashboard by hovering over the wrench icon
.png) and clicking the History button
and clicking the History button - The Project List page by clicking on the ellipsis
 located to the right of the project and selecting History
Near the top of the page is the analysis history chart. This chart displays all of the passing analyses (green), failing analyses (red), and analyses that had been both passing and failing on the same day (orange). This can be very useful for determining when a project started failing its analyses and how long it took to resolve any issues.
Days in which the project's ruleset has changed will display a black outline around that day's box. Hovering the mouse cursor over a box will provide information on the most recent ruleset change.
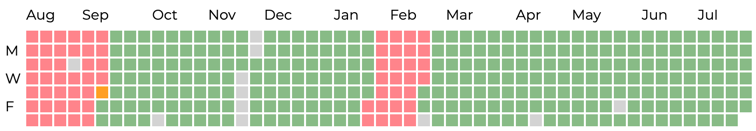
Clicking on any of the boxes in this chart will take you directly to the Project Analysis Dashboard of the most recent analysis on that day.
Beneath the history chart is more detailed information for the ten most recent analyses. Provided in each row is the date of the analysis, whether the analysis has passed or failed governance, the branch that was analyzed (if applicable), and the ruleset applied to the analysis.
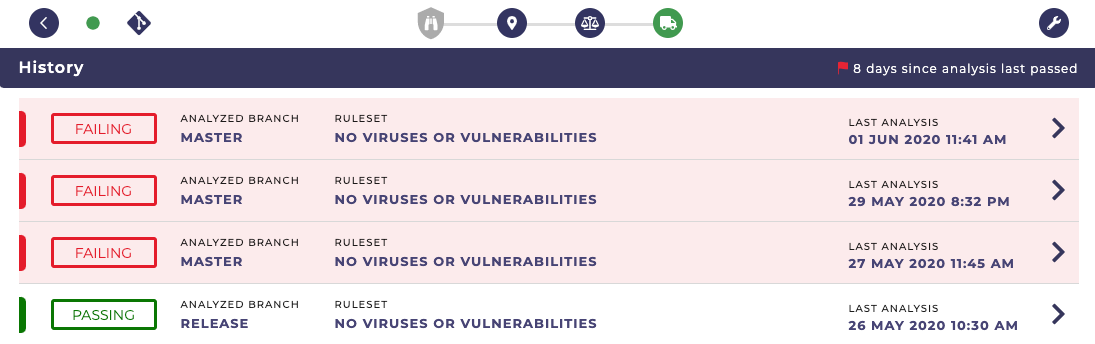
Selecting any of these analyses will take you to the Project Analysis Dashboard for that particular analysis.